My Bui (Mimi)
Data Engineer & DataOps
My LinkedIn
My GitHub
Statistical testing and fossil analysis: detecting patterns of high speciation in time and space
Goals
1. High speciation rates: when and where we observe a lot of first occurrences
2. Sampling localities by 10x10 areas and dectect high speciation rates
3. Logistic regression: what is a reasonable expectation for the proportion of first occurrences observed now given past sampling density
4. Statistical testing alpha=0.05: if the observed number of first occurrences is significantly higher than what we would expect
Attributes
- LONG and LAT give the longitude and latitude, respectively, of where a given fossil occurrence was found.
- MIN AGE and MAX AGE give an estimation of the age of the fossil (in millions of years).
- LIDNUM contains a unique identification number for each locality, where fossils have been found.
- GENUS and SPECIES give information on the taxonomic identification of the fossil.
import pandas as pd
data = pd.read_csv('NOW_public_030717.csv')
data
| LIDNUM | NAME | LATSTR | LAT | LONGSTR | LONG | MAX_AGE | BFA_MAX | FRAC_MAX | MIN_AGE | ... | TSHM | TCRWNHT | CROWNTYP | DIET_1 | DIET_2 | DIET_3 | LOCOMO1 | LOCOMO2 | LOCOMO3 | SIDNUM | |
|---|---|---|---|---|---|---|---|---|---|---|---|---|---|---|---|---|---|---|---|---|---|
| 0 | 20001 | Steinheim | 48 42 0 N | 48.700001 | 10 3 0 E | 10.050000 | 12.500000 | MN7-8 | . | 11.2 | ... | cso | . | . | a | carnivore | m/bone | te | surficial | gen_quad | 20001 |
| 1 | 20001 | Steinheim | 48 42 0 N | 48.700001 | 10 3 0 E | 10.050000 | 12.500000 | MN7-8 | . | 11.2 | ... | csp | . | . | a | carnivore | meat_only | te | scansorial | gen_quad | 20007 |
| 2 | 20001 | Steinheim | 48 42 0 N | 48.700001 | 10 3 0 E | 10.050000 | 12.500000 | MN7-8 | . | 11.2 | ... | csp | . | . | a | carnivore | meat_only | te | scansorial | gen_quad | 20008 |
| 3 | 20001 | Steinheim | 48 42 0 N | 48.700001 | 10 3 0 E | 10.050000 | 12.500000 | MN7-8 | . | 11.2 | ... | cso | . | . | a | carnivore | m/bone | te | surficial | gen_quad | 20010 |
| 4 | 20001 | Steinheim | 48 42 0 N | 48.700001 | 10 3 0 E | 10.050000 | 12.500000 | MN7-8 | . | 11.2 | ... | cso | . | . | a | carnivore | . | . | . | . | 20011 |
| ... | ... | ... | ... | ... | ... | ... | ... | ... | ... | ... | ... | ... | ... | ... | ... | ... | ... | ... | ... | ... | ... |
| 14130 | 22367 | Azambujeira inf. | 39 16 0 N | 39.266666 | 8 47 0 W | -8.783334 | 11.200000 | MN 9 | . | 9.5 | ... | bun | bra | R2200 | o | omnivore | plant_dom | te | surficial | gen_quad | 20207 |
| 14131 | 22367 | Azambujeira inf. | 39 16 0 N | 39.266666 | 8 47 0 W | -8.783334 | 11.200000 | MN 9 | . | 9.5 | ... | bun | bra | R2200 | o | omnivore | plant_dom | te | surficial | gen_quad | 25805 |
| 14132 | 22371 | Moheda | 40 05 00 N | 40.083332 | 02 43 00 W | -2.716667 | 22.799999 | MN 2 | . | 20.0 | ... | . | . | . | . | . | . | te | . | . | 25811 |
| 14133 | 22451 | Elisabethfeld | 27 00 0 S | -27.000000 | 15 14 0 E | 15.233334 | 22.799999 | MN 2 | . | 20.0 | ... | . | . | L2220 | . | . | . | te | surficial | . | 25846 |
| 14134 | 22451 | Elisabethfeld | 27 00 0 S | -27.000000 | 15 14 0 E | 15.233334 | 22.799999 | MN 2 | . | 20.0 | ... | . | . | L2220 | . | . | . | te | surficial | . | 25848 |
14135 rows × 37 columns
Data Pre-processing
Remove all rows where LAT = LONG = 0; these occurrences have incorrect coordinates. Drop rows where SPECIES is “sp.” or “indet.”; these occurrences have not been properly identified.
data = data[(data['LAT'] != 0) & (data['LONG'] != 0) &
           (data['SPECIES'] != 'sp.') & (data['SPECIES'] != 'indet.')]
Assign each occurrence to a specific Mammal Neogene (MN) time unit
mn = (data['MIN_AGE'] + data['MAX_AGE'])/2
data['MEAN_AGE'] = mn

mn = pd.cut(mn,
            bins=[0, 0.01, 0.85, 1.9, 2.5, 3.55, 5, 5.3, 7.1, 7.6, 8.9, 9.9, 11.2, 12.85, 14.2, 16.4, 17.2, 19.5, 21.7, 23, 50],
            include_lowest=True,
            labels=['post-MN', 'MQ19', 'MQ18', 'MN17', 'MN16', 'MN15', 'MN14', 'MN13', 'MN12', 'MN11', 'MN10', 'MN9', 'MN7-8', 'MN6', 'MN5', 'MN4', 'MN3', 'MN2', 'MN1', 'pre-MN'])
data['MN'] = mn
/Users/MimiHMB/anaconda3/lib/python3.7/site-packages/ipykernel_launcher.py:2: SettingWithCopyWarning:
A value is trying to be set on a copy of a slice from a DataFrame.
Try using .loc[row_indexer,col_indexer] = value instead

See the caveats in the documentation: https://pandas.pydata.org/pandas-docs/stable/user_guide/indexing.html#returning-a-view-versus-a-copy

/Users/MimiHMB/anaconda3/lib/python3.7/site-packages/ipykernel_launcher.py:8: SettingWithCopyWarning:
A value is trying to be set on a copy of a slice from a DataFrame.
Try using .loc[row_indexer,col_indexer] = value instead

See the caveats in the documentation: https://pandas.pydata.org/pandas-docs/stable/user_guide/indexing.html#returning-a-view-versus-a-copy
data[['MEAN_AGE', 'MN']]
| MEAN_AGE | MN | |
|---|---|---|
| 0 | 11.850000 | MN7-8 |
| 1 | 11.850000 | MN7-8 |
| 2 | 11.850000 | MN7-8 |
| 3 | 11.850000 | MN7-8 |
| 4 | 11.850000 | MN7-8 |
| ... | ... | ... |
| 14130 | 10.350000 | MN9 |
| 14131 | 10.350000 | MN9 |
| 14132 | 21.399999 | MN2 |
| 14133 | 21.399999 | MN2 |
| 14134 | 21.399999 | MN2 |
10248 rows × 2 columns
data.loc[data[data['NAME'] == 'Samos Main Bone Beds'].index.to_list(), 'MN'] = 'MN12'
data.loc[data[data['NAME'] == 'Can Llobateres I'].index.to_list(), 'MN'] = 'MN9'
/Users/MimiHMB/anaconda3/lib/python3.7/site-packages/pandas/core/indexing.py:966: SettingWithCopyWarning:
A value is trying to be set on a copy of a slice from a DataFrame.
Try using .loc[row_indexer,col_indexer] = value instead

See the caveats in the documentation: https://pandas.pydata.org/pandas-docs/stable/user_guide/indexing.html#returning-a-view-versus-a-copy
  self.obj[item] = s
Identify all occurrences of each species, and assign an unique identification number for each unique combination of GENUS and SPECIES
combined = data['GENUS'] + ' ' + data['SPECIES']
data['GS'] = combined

gs_id = 0
for i in combined.unique():
    data.loc[data[data['GS'] == i].index.to_list(), 'GS_ID'] = 'GS' + str(gs_id)
    gs_id += 1
/Users/MimiHMB/anaconda3/lib/python3.7/site-packages/ipykernel_launcher.py:2: SettingWithCopyWarning:
A value is trying to be set on a copy of a slice from a DataFrame.
Try using .loc[row_indexer,col_indexer] = value instead

See the caveats in the documentation: https://pandas.pydata.org/pandas-docs/stable/user_guide/indexing.html#returning-a-view-versus-a-copy

/Users/MimiHMB/anaconda3/lib/python3.7/site-packages/pandas/core/indexing.py:845: SettingWithCopyWarning:
A value is trying to be set on a copy of a slice from a DataFrame.
Try using .loc[row_indexer,col_indexer] = value instead

See the caveats in the documentation: https://pandas.pydata.org/pandas-docs/stable/user_guide/indexing.html#returning-a-view-versus-a-copy
  self.obj[key] = _infer_fill_value(value)
/Users/MimiHMB/anaconda3/lib/python3.7/site-packages/pandas/core/indexing.py:966: SettingWithCopyWarning:
A value is trying to be set on a copy of a slice from a DataFrame.
Try using .loc[row_indexer,col_indexer] = value instead

See the caveats in the documentation: https://pandas.pydata.org/pandas-docs/stable/user_guide/indexing.html#returning-a-view-versus-a-copy
  self.obj[item] = s
data[['GS', 'GS_ID']]
| GS | GS_ID | |
|---|---|---|
| 0 | Pseudocyon sansaniensis | GS0 |
| 1 | Pseudaelurus quadridentatus | GS1 |
| 2 | Pseudaelurus lorteti | GS2 |
| 3 | Pseudocyon steinheimensis | GS3 |
| 4 | Amphicyonopsis serus | GS4 |
| ... | ... | ... |
| 14130 | Propotamochoerus palaeochoerus | GS267 |
| 14131 | Conohyus cf. ebroensis | GS3046 |
| 14132 | Lorancahyus daamsi | GS3048 |
| 14133 | Propalaeoryx austroafricanus | GS3034 |
| 14134 | Sperrgebietomeryx wardi | GS3049 |
10248 rows × 2 columns
Remove duplicate localities
dup = list()

for i in data['NAME'].unique():
    a = data[data['NAME'] == i]['GS_ID'].value_counts()
    if a[a > 1].size != 0:
        b = a[a > 1].index.to_list()
        for n in b:
            c = data[(data['NAME'] == i) & (data['GS_ID'] == n)].count(axis=1)
            dup += c.sort_values().index[:-1].to_list()

dup
[102,
 1573,
 3914,
 4730,
 6203,
 6235,
 6270,
 6991,
 9620,
 10172,
 10239,
 11582,
 11923,
 12716,
 13551]
data.drop(dup, inplace=True)
/Users/MimiHMB/anaconda3/lib/python3.7/site-packages/pandas/core/frame.py:3997: SettingWithCopyWarning:
A value is trying to be set on a copy of a slice from a DataFrame

See the caveats in the documentation: https://pandas.pydata.org/pandas-docs/stable/user_guide/indexing.html#returning-a-view-versus-a-copy
  errors=errors,
1. High speciation rates: when and where we observe a lot of first occurrences
- Create a DataFrame that shows for each species how many occurrences it has in each time unit
- Create a different DataFrame that shows for each species the time unit when it is first observed (i.e. the oldest time unit).
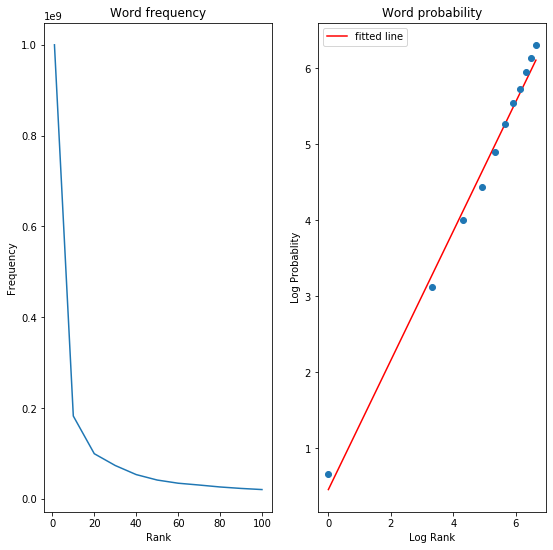
- For each time unit, calculate the proportion of first occurrences to all occurrences.
summary_loc = data[['LIDNUM', 'GS_ID']].groupby('LIDNUM').count()
summary_loc.columns = ['TOTAL']
summary_loc['OLDEST_COUNT'] = 0

def summary(data, groupby_col):
    summary = data.pivot_table(index=groupby_col, columns='MN', aggfunc='size')
    summary_total = summary.sum(axis=0)

    '''
    print('For each species how many occurrences it has in each time unit:')
    print(summary)
    print('\n')
    '''

    return summary_total


def ratio(data, groupby_col):
    oldest = pd.DataFrame(pd.cut(data.groupby(groupby_col)['MEAN_AGE'].max(),
            bins=[0, 0.01, 0.85, 1.9, 2.5, 3.55, 5, 5.3, 7.1, 7.6, 8.9, 9.9, 11.2, 12.85, 14.2, 16.4, 17.2, 19.5, 21.7, 23, 50],
            include_lowest=True,
            labels=['post-MN', 'MQ19', 'MQ18', 'MN17', 'MN16', 'MN15', 'MN14', 'MN13', 'MN12', 'MN11', 'MN10', 'MN9', 'MN7-8', 'MN6', 'MN5', 'MN4', 'MN3', 'MN2', 'MN1', 'pre-MN']))
    oldest.columns = ['OLDEST_MN']
    for i in oldest.index:
        data_temp = data[(data['GS_ID'] == i) & (data['MN'] == oldest.loc[i]['OLDEST_MN'])]
        count = int(len(data_temp))
        oldest.loc[i, 'OLDEST_COUNT'] = count
        loc = data_temp['LIDNUM']

        for n in loc.values:
            summary_loc.loc[n, 'OLDEST_COUNT'] += 1

    summary_oldest = oldest.pivot_table(index='OLDEST_MN', values='OLDEST_COUNT', aggfunc='sum')
    output = summary_oldest['OLDEST_COUNT']/summary(data, groupby_col)

    '''
    print('For each species the time unit when it is first observed:')
    print(oldest)
    print('\n')

    print('For each time what is the proportion of first occurrences to all occurrences')
    print(output)
    '''

    return output
ratio_mn = ratio(data, 'GS_ID')
ratio_mn
OLDEST_MN
post-MN    0.000000
MQ19       0.527027
MQ18       0.517341
MN17       0.230563
MN16       0.573810
MN15       0.659011
MN14       0.250000
MN13       0.472527
MN12       0.171429
MN11       0.441199
MN10       0.474886
MN9        0.366146
MN7-8      0.412844
MN6        0.248722
MN5        0.424865
MN4        0.516588
MN3        0.862408
MN2        0.613014
MN1        0.506329
pre-MN     1.000000
dtype: float64
summary_total = summary(data, 'GS_ID')
summary_total_norm = (summary_total - summary_total.min())/(summary_total.max() - summary_total.min())
summary_total
MN
post-MN       4
MQ19        518
MQ18        346
MN17        373
MN16        840
MN15       1132
MN14         12
MN13        728
MN12         35
MN11       1301
MN10        438
MN9         833
MN7-8       545
MN6         587
MN5         925
MN4         211
MN3         814
MN2         292
MN1          79
pre-MN      220
dtype: int64
import matplotlib
import matplotlib.pyplot as plt

fig = plt.figure(figsize=(15, 5))
ax = fig.add_subplot(111)
ax.plot(ratio_mn)
ax.plot(summary_total_norm)
plt.legend(['proportion of first occurrences', 'total occurrences'])
plt.show()
2. Sampling localities by 10x10 areas and dectect high speciation rates
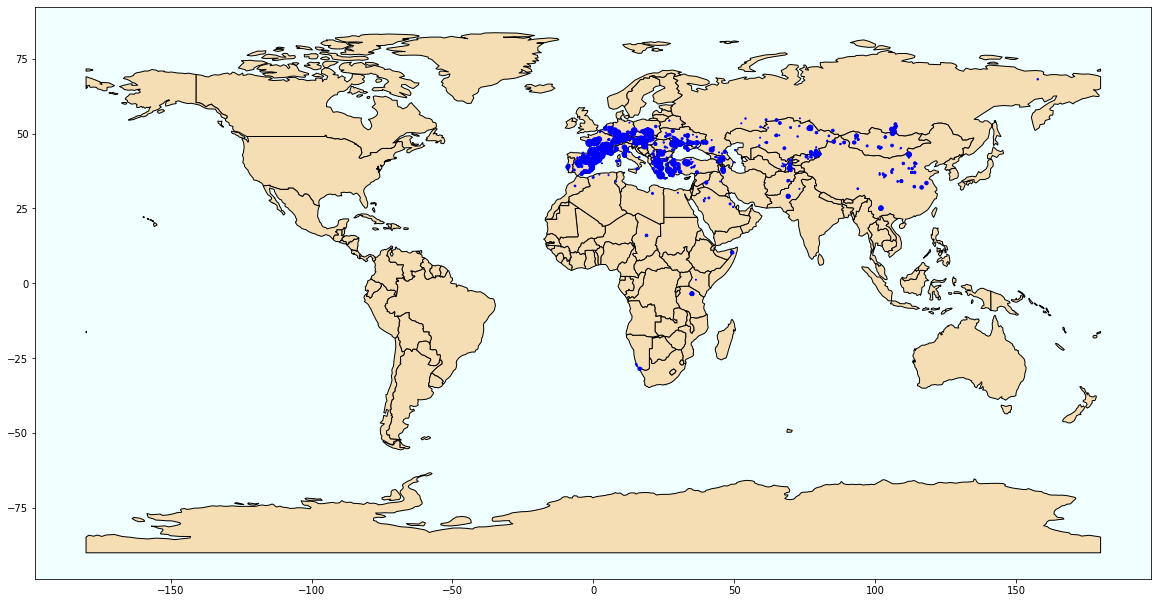
Create a DataFrame that collects the following information for every locality: locality number (LIDNUM), longitude, latitude, time unit, number of first occurrences in the locality, number of all occurrences in the locality and proportion of first occurrences in the locality.
summary_loc['RATIO'] = summary_loc['OLDEST_COUNT']/summary_loc['TOTAL']

for i in summary_loc.index:
    summary_loc.loc[i, 'LAT'] = data.loc[data['LIDNUM'] == i, 'LAT'].head(1).values[0]
    summary_loc.loc[i, 'LONG'] = data.loc[data['LIDNUM'] == i, 'LONG'].head(1).values[0]
    summary_loc.loc[i, 'MN'] = data.loc[data['LIDNUM'] == i, 'MN'].head(1).values[0]
summary_loc
| TOTAL | OLDEST_COUNT | RATIO | LAT | LONG | MN | |
|---|---|---|---|---|---|---|
| LIDNUM | ||||||
| 20001 | 51 | 10 | 0.196078 | 48.700001 | 10.050000 | MN7-8 |
| 20002 | 70 | 20 | 0.285714 | 43.900002 | -0.500000 | MN6 |
| 20003 | 36 | 29 | 0.805556 | 40.000000 | 28.500000 | MN5 |
| 20005 | 20 | 3 | 0.150000 | 48.099998 | 2.150000 | MN5 |
| 20006 | 25 | 22 | 0.880000 | 48.099998 | 1.900000 | MN3 |
| ... | ... | ... | ... | ... | ... | ... |
| 22365 | 2 | 2 | 1.000000 | 40.299999 | -2.283333 | MN3 |
| 22366 | 1 | 1 | 1.000000 | 40.299999 | -2.283333 | MN3 |
| 22367 | 3 | 1 | 0.333333 | 39.266666 | -8.783334 | MN9 |
| 22371 | 1 | 1 | 1.000000 | 40.083332 | -2.716667 | MN2 |
| 22451 | 2 | 2 | 1.000000 | -27.000000 | 15.233334 | MN2 |
1418 rows × 6 columns
import geopandas

world = (geopandas.read_file(geopandas.datasets.get_path('naturalearth_lowres')))
from shapely.geometry import Point, Polygon

geo_df = geopandas.GeoDataFrame(summary_loc, crs={'init': 'epsg:4326'}, geometry=[Point(xy) for xy in zip(summary_loc['LONG'], summary_loc['LAT'])])
/Users/MimiHMB/anaconda3/lib/python3.7/site-packages/pyproj/crs/crs.py:53: FutureWarning: '+init=<authority>:<code>' syntax is deprecated. '<authority>:<code>' is the preferred initialization method. When making the change, be mindful of axis order changes: https://pyproj4.github.io/pyproj/stable/gotchas.html#axis-order-changes-in-proj-6
  return _prepare_from_string(" ".join(pjargs))
fig, ax = plt.subplots(figsize=(20, 20))
world.plot(ax=ax, color='wheat', edgecolor='black')
geo_df.plot(ax=ax, markersize='TOTAL', color='blue', marker='o')
ax.set_facecolor('azure')
plt.savefig('loc_total_occ')
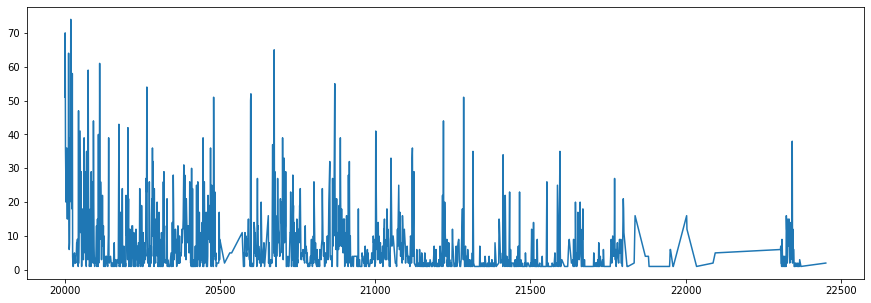
fig = plt.figure(figsize=(15, 5))
ax = fig.add_subplot(111)
ax.plot(summary_loc['TOTAL'])
plt.show()
For each locality,
- look at a ten by ten degrees area (in latitude and longitude) centered around the locality
- record the total number of occurrences and total number of first occurrences found within that square in the time unit corresponding to the focal locality
- record the total number of occurrences within that square in the preceding time unit (relative to the focal locality)
summary_loc_1010 = summary_loc.iloc[:, :-1]

labels = ['post-MN', 'MQ19', 'MQ18', 'MN17', 'MN16', 'MN15', 'MN14',
          'MN13', 'MN12', 'MN11', 'MN10', 'MN9', 'MN7-8', 'MN6', 'MN5',
          'MN4', 'MN3', 'MN2', 'MN1', 'pre-MN']

for i in summary_loc_1010.index:
    summary_loc_1010.loc[i, 'LAT+5'] = summary_loc_1010.loc[i, 'LAT'] + 5
    summary_loc_1010.loc[i, 'LAT-5'] = summary_loc_1010.loc[i, 'LAT'] - 5
    summary_loc_1010.loc[i, 'LONG+5'] = summary_loc_1010.loc[i, 'LONG'] + 5
    summary_loc_1010.loc[i, 'LONG-5'] = summary_loc_1010.loc[i, 'LONG'] - 5

    index = labels.index(summary_loc_1010.loc[i, 'MN'])
    temp_data = summary_loc_1010[(summary_loc_1010['LAT'] <= summary_loc_1010.loc[i, 'LAT+5']) &
                (summary_loc_1010['LAT'] >= summary_loc_1010.loc[i, 'LAT-5']) &
                (summary_loc_1010['LONG'] <= summary_loc_1010.loc[i, 'LONG+5']) &
                (summary_loc_1010['LONG'] >= summary_loc_1010.loc[i, 'LONG-5'])]
    summary_loc_1010.loc[i, 'TOTAL_10'] = temp_data['TOTAL'].sum()
    summary_loc_1010.loc[i, 'OLDEST_COUNT_10'] = temp_data['OLDEST_COUNT'].sum()

    if (index != 0):
        if (index < len(labels) - 1):
            pre_mn = labels[index + 1]
        else:
            pre_mn = labels[-1]
    else:
        pre_mn = labels[0]

    temp_data_2 = temp_data[temp_data['MN'] == pre_mn]
    summary_loc_1010.loc[i, 'PRE_MN'] = pre_mn
    summary_loc_1010.loc[i, 'TOTAL_PRE'] = temp_data_2['TOTAL'].sum()
    summary_loc_1010.loc[i, 'OLDEST_COUNT_PRE'] = temp_data_2['OLDEST_COUNT'].sum()
summary_loc_1010.iloc[:, [0, 1, -5, -4, -2, -1]]
| TOTAL | OLDEST_COUNT | TOTAL_10 | OLDEST_COUNT_10 | TOTAL_PRE | OLDEST_COUNT_PRE | |
|---|---|---|---|---|---|---|
| LIDNUM | ||||||
| 20001 | 51 | 10 | 2021.0 | 882.0 | 214.0 | 31.0 |
| 20002 | 70 | 20 | 2863.0 | 1375.0 | 261.0 | 77.0 |
| 20003 | 36 | 29 | 858.0 | 463.0 | 0.0 | 0.0 |
| 20005 | 20 | 3 | 1761.0 | 769.0 | 70.0 | 42.0 |
| 20006 | 25 | 22 | 1725.0 | 746.0 | 159.0 | 99.0 |
| ... | ... | ... | ... | ... | ... | ... |
| 22365 | 2 | 2 | 2344.0 | 1137.0 | 69.0 | 50.0 |
| 22366 | 1 | 1 | 2344.0 | 1137.0 | 69.0 | 50.0 |
| 22367 | 3 | 1 | 219.0 | 96.0 | 11.0 | 4.0 |
| 22371 | 1 | 1 | 2327.0 | 1131.0 | 0.0 | 0.0 |
| 22451 | 2 | 2 | 16.0 | 16.0 | 0.0 | 0.0 |
1418 rows × 6 columns
summary_loc_1010.iloc[:, [0, 1, -5, -4, -2, -1]].describe()
| TOTAL | OLDEST_COUNT | TOTAL_10 | OLDEST_COUNT_10 | TOTAL_PRE | OLDEST_COUNT_PRE | |
|---|---|---|---|---|---|---|
| count | 1418.000000 | 1418.000000 | 1418.000000 | 1418.000000 | 1418.000000 | 1418.000000 |
| mean | 7.216502 | 3.681241 | 1433.684062 | 676.825811 | 78.433004 | 37.643159 |
| std | 9.568552 | 5.659967 | 1027.140349 | 464.465819 | 97.701041 | 49.187365 |
| min | 1.000000 | 0.000000 | 2.000000 | 1.000000 | 0.000000 | 0.000000 |
| 25% | 1.000000 | 1.000000 | 504.000000 | 241.500000 | 2.000000 | 0.000000 |
| 50% | 3.000000 | 1.000000 | 1250.000000 | 612.000000 | 45.500000 | 19.000000 |
| 75% | 9.000000 | 4.000000 | 2357.000000 | 1102.750000 | 118.000000 | 58.000000 |
| max | 74.000000 | 54.000000 | 3282.000000 | 1529.000000 | 489.000000 | 316.000000 |
3. Logistic regression: what is a reasonable expectation for the proportion of first occurrences observed now given past sampling density
Create the regression data set, but only use localities in Europe
- Each row in the array represents one occurrence.
- For each occurrence, the first column of the data frame is the number of occurrences in the focal area in the previous time unit.
- For the second column, 1 for a first occurrence and 0 for other occurrences
data_7 = data[(-25 < data['LONG']) & (data['LONG'] > 35) & (data['MN'] != 'MN1') & (data['MN'] != 'post-MN') & (data['MN'] != 'pre-MN')]
pre_df = summary_loc_1010.reset_index()[['LIDNUM', 'TOTAL_10', 'OLDEST_COUNT_10', 'TOTAL_PRE']]
regression = data_7.merge(pre_df, on='LIDNUM', suffixes='_2')
def oldest_occ(data, groupby_col):
    oldest = pd.DataFrame(pd.cut(data.groupby(groupby_col)['MEAN_AGE'].max(),
            bins=[0, 0.01, 0.85, 1.9, 2.5, 3.55, 5, 5.3, 7.1, 7.6, 8.9, 9.9, 11.2, 12.85, 14.2, 16.4, 17.2, 19.5, 21.7, 23, 50],
            include_lowest=True,
            labels=['post-MN', 'MQ19', 'MQ18', 'MN17', 'MN16', 'MN15', 'MN14', 'MN13', 'MN12', 'MN11', 'MN10', 'MN9', 'MN7-8', 'MN6', 'MN5', 'MN4', 'MN3', 'MN2', 'MN1', 'pre-MN']))
    oldest.columns = ['OLDEST_MN']

    return oldest
oldest_occ_df = oldest_occ(data_7, 'GS_ID').reset_index()
regression = regression.merge(oldest_occ_df, on='GS_ID', suffixes='_2')
regression['OLDEST_CHECK'] = regression['MN'] == regression['OLDEST_MN']
regression['OLDEST_CHECK'] = regression['OLDEST_CHECK'].astype('int')
regression
| LIDNUM | NAME | LATSTR | LAT | LONGSTR | LONG | MAX_AGE | BFA_MAX | FRAC_MAX | MIN_AGE | ... | SIDNUM | MEAN_AGE | MN | GS | GS_ID | TOTAL_10 | OLDEST_COUNT_10 | TOTAL_PRE | OLDEST_MN | OLDEST_CHECK | |
|---|---|---|---|---|---|---|---|---|---|---|---|---|---|---|---|---|---|---|---|---|---|
| 0 | 20024 | Maragheh | 37 21 00 N | 37.349998 | 46 07 00 E | 46.116665 | 9.0 | MN 11 | . | 7.1 | ... | 20131 | 8.05 | MN11 | Indarctos atticus | GS371 | 147.0 | 70.0 | 23.0 | MN11 | 1 |
| 1 | 20024 | Maragheh | 37 21 00 N | 37.349998 | 46 07 00 E | 46.116665 | 9.0 | MN 11 | . | 7.1 | ... | 20132 | 8.05 | MN11 | Parataxidea maraghana | GS372 | 147.0 | 70.0 | 23.0 | MN11 | 1 |
| 2 | 20462 | Middle Maragheh | 38 0 0 N | 38.000000 | 46 0 0 E | 46.000000 | 8.2 | MN 12 | . | 7.1 | ... | 20132 | 7.65 | MN11 | Parataxidea maraghana | GS372 | 147.0 | 70.0 | 23.0 | MN11 | 1 |
| 3 | 20024 | Maragheh | 37 21 00 N | 37.349998 | 46 07 00 E | 46.116665 | 9.0 | MN 11 | . | 7.1 | ... | 20138 | 8.05 | MN11 | Metailurus major | GS332 | 147.0 | 70.0 | 23.0 | MN11 | 1 |
| 4 | 20024 | Maragheh | 37 21 00 N | 37.349998 | 46 07 00 E | 46.116665 | 9.0 | MN 11 | . | 7.1 | ... | 20140 | 8.05 | MN11 | Martes collongensis | GS373 | 147.0 | 70.0 | 23.0 | MN11 | 1 |
| ... | ... | ... | ... | ... | ... | ... | ... | ... | ... | ... | ... | ... | ... | ... | ... | ... | ... | ... | ... | ... | ... |
| 1243 | 22307 | Loh | 45 15 00 N | 45.250000 | 101 45 00 E | 101.750000 | 28.0 | RMC | . | 5.3 | ... | 25697 | 16.65 | MN4 | Heterosminthus firmus | GS2999 | 109.0 | 96.0 | 0.0 | MN4 | 1 |
| 1244 | 22307 | Loh | 45 15 00 N | 45.250000 | 101 45 00 E | 101.750000 | 28.0 | RMC | . | 5.3 | ... | 25698 | 16.65 | MN4 | Heterosminthus cf. firmus | GS3000 | 109.0 | 96.0 | 0.0 | MN4 | 1 |
| 1245 | 22316 | Builstyn Khudag | 45 25 00 N | 45.416668 | 101 30 00 E | 101.500000 | 10.0 | RME | . | 8.0 | ... | 25700 | 9.00 | MN10 | Heterosminthus gansus | GS3005 | 109.0 | 96.0 | 0.0 | MN10 | 1 |
| 1246 | 22317 | Olon Ovoony Churem | 45 30 00 N | 45.500000 | 101 10 00 E | 101.166664 | 17.0 | RMD1 | . | 14.0 | ... | 25699 | 15.50 | MN5 | Heterosminthus mongoliensis | GS3006 | 76.0 | 69.0 | 9.0 | MN5 | 1 |
| 1247 | 22318 | Ulaan Tolgoi | 45 15 00 N | 45.250000 | 101 50 00 E | 101.833336 | 17.0 | RMD1 | . | 14.0 | ... | 25699 | 15.50 | MN5 | Heterosminthus mongoliensis | GS3006 | 109.0 | 96.0 | 9.0 | MN5 | 1 |
1248 rows × 46 columns
regression_df = regression[['TOTAL_PRE', 'OLDEST_CHECK']]
regression_df
| TOTAL_PRE | OLDEST_CHECK | |
|---|---|---|
| 0 | 23.0 | 1 |
| 1 | 23.0 | 1 |
| 2 | 23.0 | 1 |
| 3 | 23.0 | 1 |
| 4 | 23.0 | 1 |
| ... | ... | ... |
| 1243 | 0.0 | 1 |
| 1244 | 0.0 | 1 |
| 1245 | 0.0 | 1 |
| 1246 | 9.0 | 1 |
| 1247 | 9.0 | 1 |
1248 rows × 2 columns
from sklearn.linear_model import LogisticRegression
from sklearn.model_selection import train_test_split

X_train, X_test, y_train, y_test = train_test_split(regression_df['TOTAL_PRE'], regression_df['OLDEST_CHECK'])
clf = LogisticRegression()
clf.fit(np.array(X_train).reshape(-1, 1), y_train)
LogisticRegression(C=1.0, class_weight=None, dual=False, fit_intercept=True,
                   intercept_scaling=1, l1_ratio=None, max_iter=100,
                   multi_class='auto', n_jobs=None, penalty='l2',
                   random_state=None, solver='lbfgs', tol=0.0001, verbose=0,
                   warm_start=False)
y_pred = clf.predict(np.array(X_test).reshape(-1, 1))
from sklearn.metrics import accuracy_score

print('Baseline Accuracy score: {:.5f}'.format(accuracy_score(y_test, y_pred)))
Baseline Accuracy score: 0.76923
first_occ_pred = clf.predict(np.array(regression_df['TOTAL_PRE']).reshape(-1, 1))
regression['OLDEST_PRED'] = first_occ_pred
for i in regression.index:
    regression.loc[i, 'LAT+5'] = regression.loc[i, 'LAT'] + 5
    regression.loc[i, 'LAT-5'] = regression.loc[i, 'LAT'] - 5
    regression.loc[i, 'LONG+5'] = regression.loc[i, 'LONG'] + 5
    regression.loc[i, 'LONG-5'] = regression.loc[i, 'LONG'] - 5

    temp_data = regression[(regression['LAT'] <= regression.loc[i, 'LAT+5']) &
                (regression['LAT'] >= regression.loc[i, 'LAT-5']) &
                (regression['LONG'] <= regression.loc[i, 'LONG+5']) &
                (regression['LONG'] >= regression.loc[i, 'LONG-5'])]

    regression.loc[i, 'OLDEST_COUNT_10_PRED'] = temp_data.groupby('LIDNUM').sum()['OLDEST_PRED'].sum()
regression
| LIDNUM | NAME | LATSTR | LAT | LONGSTR | LONG | MAX_AGE | BFA_MAX | FRAC_MAX | MIN_AGE | ... | OLDEST_COUNT_10 | TOTAL_PRE | OLDEST_MN | OLDEST_CHECK | OLDEST_PRED | LAT+5 | LAT-5 | LONG+5 | LONG-5 | OLDEST_COUNT_10_PRED | |
|---|---|---|---|---|---|---|---|---|---|---|---|---|---|---|---|---|---|---|---|---|---|
| 0 | 20024 | Maragheh | 37 21 00 N | 37.349998 | 46 07 00 E | 46.116665 | 9.0 | MN 11 | . | 7.1 | ... | 70.0 | 23.0 | MN11 | 1 | 1 | 42.349998 | 32.349998 | 51.116665 | 41.116665 | 147.0 |
| 1 | 20024 | Maragheh | 37 21 00 N | 37.349998 | 46 07 00 E | 46.116665 | 9.0 | MN 11 | . | 7.1 | ... | 70.0 | 23.0 | MN11 | 1 | 1 | 42.349998 | 32.349998 | 51.116665 | 41.116665 | 147.0 |
| 2 | 20462 | Middle Maragheh | 38 0 0 N | 38.000000 | 46 0 0 E | 46.000000 | 8.2 | MN 12 | . | 7.1 | ... | 70.0 | 23.0 | MN11 | 1 | 1 | 43.000000 | 33.000000 | 51.000000 | 41.000000 | 147.0 |
| 3 | 20024 | Maragheh | 37 21 00 N | 37.349998 | 46 07 00 E | 46.116665 | 9.0 | MN 11 | . | 7.1 | ... | 70.0 | 23.0 | MN11 | 1 | 1 | 42.349998 | 32.349998 | 51.116665 | 41.116665 | 147.0 |
| 4 | 20024 | Maragheh | 37 21 00 N | 37.349998 | 46 07 00 E | 46.116665 | 9.0 | MN 11 | . | 7.1 | ... | 70.0 | 23.0 | MN11 | 1 | 1 | 42.349998 | 32.349998 | 51.116665 | 41.116665 | 147.0 |
| ... | ... | ... | ... | ... | ... | ... | ... | ... | ... | ... | ... | ... | ... | ... | ... | ... | ... | ... | ... | ... | ... |
| 1243 | 22307 | Loh | 45 15 00 N | 45.250000 | 101 45 00 E | 101.750000 | 28.0 | RMC | . | 5.3 | ... | 96.0 | 0.0 | MN4 | 1 | 1 | 50.250000 | 40.250000 | 106.750000 | 96.750000 | 69.0 |
| 1244 | 22307 | Loh | 45 15 00 N | 45.250000 | 101 45 00 E | 101.750000 | 28.0 | RMC | . | 5.3 | ... | 96.0 | 0.0 | MN4 | 1 | 1 | 50.250000 | 40.250000 | 106.750000 | 96.750000 | 69.0 |
| 1245 | 22316 | Builstyn Khudag | 45 25 00 N | 45.416668 | 101 30 00 E | 101.500000 | 10.0 | RME | . | 8.0 | ... | 96.0 | 0.0 | MN10 | 1 | 1 | 50.416668 | 40.416668 | 106.500000 | 96.500000 | 69.0 |
| 1246 | 22317 | Olon Ovoony Churem | 45 30 00 N | 45.500000 | 101 10 00 E | 101.166664 | 17.0 | RMD1 | . | 14.0 | ... | 69.0 | 9.0 | MN5 | 1 | 1 | 50.500000 | 40.500000 | 106.166664 | 96.166664 | 36.0 |
| 1247 | 22318 | Ulaan Tolgoi | 45 15 00 N | 45.250000 | 101 50 00 E | 101.833336 | 17.0 | RMD1 | . | 14.0 | ... | 96.0 | 9.0 | MN5 | 1 | 1 | 50.250000 | 40.250000 | 106.833336 | 96.833336 | 69.0 |
1248 rows × 52 columns
4. Statistical testing with alpha=0.05: if the observed number of first occurrences is significantly higher than what we would expect
For each European locality, calculate the expected proportion of first occurrences in the focal area surrounding the locality using the logistic regression calculated
stats = regression.groupby('LIDNUM').sum()[['TOTAL_10', 'OLDEST_COUNT_10', 'OLDEST_COUNT_10_PRED', 'TOTAL_PRE', 'OLDEST_CHECK', 'OLDEST_PRED']]
stats['RATIO'] = stats['OLDEST_COUNT_10']/stats['TOTAL_10']
stats['RATIO_PRED'] = stats['OLDEST_COUNT_10_PRED']/stats['TOTAL_10']
stats
| TOTAL_10 | OLDEST_COUNT_10 | OLDEST_COUNT_10_PRED | TOTAL_PRE | OLDEST_CHECK | OLDEST_PRED | RATIO | RATIO_PRED | |
|---|---|---|---|---|---|---|---|---|
| LIDNUM | ||||||||
| 20024 | 2646.0 | 1260.0 | 2646.0 | 414.0 | 18 | 18 | 0.476190 | 1.000000 |
| 20103 | 767.0 | 442.0 | 767.0 | 39.0 | 6 | 13 | 0.576271 | 1.000000 |
| 20126 | 192.0 | 103.0 | 20.0 | 16.0 | 1 | 1 | 0.536458 | 0.104167 |
| 20127 | 2120.0 | 1090.0 | 230.0 | 530.0 | 9 | 10 | 0.514151 | 0.108491 |
| 20128 | 848.0 | 436.0 | 92.0 | 84.0 | 2 | 4 | 0.514151 | 0.108491 |
| ... | ... | ... | ... | ... | ... | ... | ... | ... |
| 22095 | 690.0 | 565.0 | 690.0 | 55.0 | 5 | 5 | 0.818841 | 1.000000 |
| 22307 | 218.0 | 192.0 | 138.0 | 0.0 | 2 | 2 | 0.880734 | 0.633028 |
| 22316 | 109.0 | 96.0 | 69.0 | 0.0 | 1 | 1 | 0.880734 | 0.633028 |
| 22317 | 76.0 | 69.0 | 36.0 | 9.0 | 1 | 1 | 0.907895 | 0.473684 |
| 22318 | 109.0 | 96.0 | 69.0 | 9.0 | 1 | 1 | 0.880734 | 0.633028 |
257 rows × 8 columns
from scipy.stats import binom_test

for i in stats.index:
    stats.loc[i, 'p'] = binom_test(stats.loc[i, 'OLDEST_COUNT_10_PRED'], stats.loc[i, 'TOTAL_10'], stats.loc[i, 'RATIO'], alternative='greater')
stats['SS'] = stats['p'] <= 0.05
stats['SS'] = stats['SS'].astype(int)
stats
| TOTAL_10 | OLDEST_COUNT_10 | OLDEST_COUNT_10_PRED | TOTAL_PRE | OLDEST_CHECK | OLDEST_PRED | RATIO | RATIO_PRED | p | SS | |
|---|---|---|---|---|---|---|---|---|---|---|
| LIDNUM | ||||||||||
| 20024 | 2646.0 | 1260.0 | 2646.0 | 414.0 | 18 | 18 | 0.476190 | 1.000000 | 0.000000e+00 | 1 |
| 20103 | 767.0 | 442.0 | 767.0 | 39.0 | 6 | 13 | 0.576271 | 1.000000 | 2.516729e-184 | 1 |
| 20126 | 192.0 | 103.0 | 20.0 | 16.0 | 1 | 1 | 0.536458 | 0.104167 | 1.000000e+00 | 0 |
| 20127 | 2120.0 | 1090.0 | 230.0 | 530.0 | 9 | 10 | 0.514151 | 0.108491 | 1.000000e+00 | 0 |
| 20128 | 848.0 | 436.0 | 92.0 | 84.0 | 2 | 4 | 0.514151 | 0.108491 | 1.000000e+00 | 0 |
| ... | ... | ... | ... | ... | ... | ... | ... | ... | ... | ... |
| 22095 | 690.0 | 565.0 | 690.0 | 55.0 | 5 | 5 | 0.818841 | 1.000000 | 1.281021e-60 | 1 |
| 22307 | 218.0 | 192.0 | 138.0 | 0.0 | 2 | 2 | 0.880734 | 0.633028 | 1.000000e+00 | 0 |
| 22316 | 109.0 | 96.0 | 69.0 | 0.0 | 1 | 1 | 0.880734 | 0.633028 | 1.000000e+00 | 0 |
| 22317 | 76.0 | 69.0 | 36.0 | 9.0 | 1 | 1 | 0.907895 | 0.473684 | 1.000000e+00 | 0 |
| 22318 | 109.0 | 96.0 | 69.0 | 9.0 | 1 | 1 | 0.880734 | 0.633028 | 1.000000e+00 | 0 |
257 rows × 10 columns
output = stats[stats['SS'] == 1].reset_index()
output_geo = output.merge(regression[['LIDNUM', 'LAT', 'LONG']], on='LIDNUM', suffixes='_2')
geo_df = geopandas.GeoDataFrame(output_geo, crs={'init': 'epsg:4326'}, geometry=[Point(xy) for xy in zip(output_geo['LONG'], output_geo['LAT'])])

output_0 = stats[stats['SS'] == 0].reset_index()
output_geo_0 = output_0.merge(regression[['LIDNUM', 'LAT', 'LONG']], on='LIDNUM', suffixes='_2')
geo_df_0 = geopandas.GeoDataFrame(output_geo_0, crs={'init': 'epsg:4326'}, geometry=[Point(xy) for xy in zip(output_geo_0['LONG'], output_geo_0['LAT'])])
/Users/MimiHMB/anaconda3/lib/python3.7/site-packages/pyproj/crs/crs.py:53: FutureWarning: '+init=<authority>:<code>' syntax is deprecated. '<authority>:<code>' is the preferred initialization method. When making the change, be mindful of axis order changes: https://pyproj4.github.io/pyproj/stable/gotchas.html#axis-order-changes-in-proj-6
  return _prepare_from_string(" ".join(pjargs))
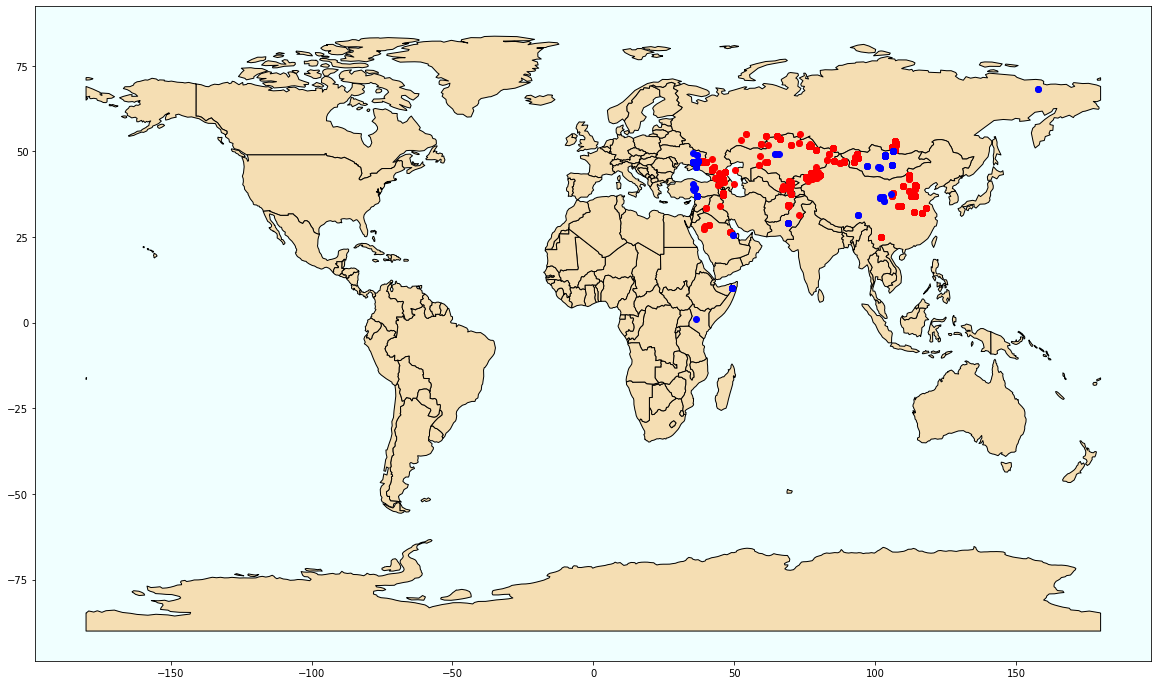
Areas with statistically high speciation rate are marked red
fig, ax = plt.subplots(figsize=(20, 20))
world.plot(ax=ax, color='wheat', edgecolor='black')
geo_df.plot(ax=ax, color='red', marker='o')
geo_df_0.plot(ax=ax, color='blue', marker='o')
ax.set_facecolor('azure')
plt.savefig('loc_total_occ')