My Bui (Mimi)
Data Engineer & DataOps
My LinkedIn
My GitHub
Mean testing using permutation 1000 times and t-test
Goals
1. Determine which leadership construct significantly changes over pre-Covid and during-Covid times
2. Hypothesis testing: difference in means
3. Find the average differences
| changes = exp - covid | p_values_permutation | p_values_t_test | significant | |
|---|---|---|---|---|
| AHC | 0.345929 | 0.000 | 0.0000 | 1 |
| Bout | -0.182161 | 0.000 | 0.0000 | 1 |
| CO | 0.256943 | 0.000 | 0.0000 | 1 |
| GC | 0.355430 | 0.000 | 0.0000 | 1 |
| IPC | 0.174999 | 0.000 | 0.0000 | 1 |
| LMX | 0.021892 | 0.096 | 0.0846 | 0 |
| LS | 0.004266 | 0.447 | 0.4497 | 0 |
| MF | 0.395901 | 0.000 | 0.0000 | 1 |
| PS | -0.009199 | 0.383 | 0.3950 | 0 |
| RE | 0.045658 | 0.002 | 0.0016 | 1 |
| WES | 0.182599 | 0.000 | 0.0000 | 1 |
| WLC | -0.894634 | 0.000 | 0.0000 | 1 |
| WLSP | 0.819718 | 0.000 | 0.0000 | 1 |
import pandas as pd
import numpy as np
import random
from scipy import stats
import matplotlib.pyplot as plt
Leadership constructs are abbreviated: after-hour connectivity, burnout, collaborative overload, goal clarity, etc. For more information, please contact My Bui.
label = ['AHC', 'Bout', 'CO', 'GC', 'IPC', 'LMX', 'LS', 'MF', 'PS', 'RE', 'WES', 'WLC', 'WLSP']
def read_data(construct):
    data_B = pd.read_excel(construct + '.xlsx', sheet_name='covid')
    data_A = pd.read_excel(construct + '.xlsx', sheet_name='exp')
    array_B = data_B.values.reshape(1, -1)[0]
    array_B = array_B[~np.isnan(array_B)]
    array_A = data_A.values.reshape(1, -1)[0]
    array_A = array_A[~np.isnan(array_A)]

    return (array_A, array_B)


def combine(array_A, array_B):
    x = array_A.tolist()
    x += array_B.tolist()

    return x


def permutation_A_B(x, n_B, n_A):
    random.shuffle(x)
    x = pd.Series(x)
    n = n_A + n_B
    idx_A = set(random.sample(range(n), n_A))
    idx_B = set(range(n)) - idx_A

    return x.loc[idx_A].mean() - x.loc[idx_B].mean()


def permutation_B_A(x, n_B, n_A):
    random.shuffle(x)
    x = pd.Series(x)
    n = n_A + n_B
    idx_A = set(random.sample(range(n), n_A))
    idx_B = set(range(n)) - idx_A

    return x.loc[idx_B].mean() - x.loc[idx_A].mean()
p_perm_list = []
p_t_test = []
for i in label:
array_A, array_B = read_data(i)
combine(array_A, array_B)
diff = np.mean(array_A) - np.mean(array_B)
x = combine(array_A, array_B)
if (diff < 0):
print('For ' + i + ': Covid > Exp')
diff = np.mean(array_B) - np.mean(array_A)
perm_diffs = [permutation_B_A(x, len(array_B.tolist()), len(array_A.tolist())) for _ in range(1000)]
else:
print('For ' + i + ': Exp > Covid')
perm_diffs = [permutation_A_B(x, len(array_B.tolist()), len(array_A.tolist())) for _ in range(1000)]
fig, ax = plt.subplots()
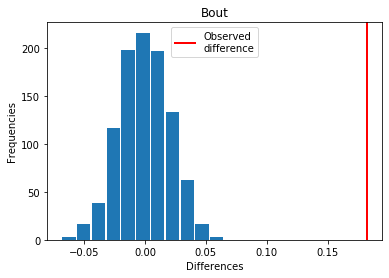
ax.hist(perm_diffs, bins=11, rwidth=0.9)
ax.axvline(x=diff, color='red', lw=2)
ax.set_xlabel('Differences')
ax.set_ylabel('Frequencies')
plt.legend(['Observed\ndifference'])
ax.set_title(i)
plt.show()
p_perm = np.mean(perm_diffs >= diff)
p_perm_list.append(p_perm)
print(f'p_perm: {p_perm}')
res = stats.ttest_ind(array_A, array_B, equal_var=False)
p_t_test.append(res.pvalue/2)
print(f'p_t_test: {res.pvalue / 2:.4f}')
print('\n')
For AHC: Exp > Covid
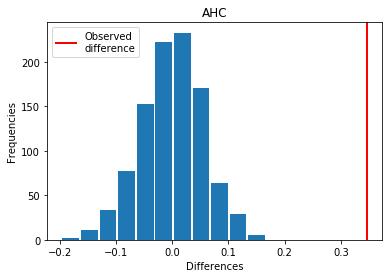
p_perm: 0.0
p_t_test: 0.0000


For Bout: Covid > Exp
p_perm: 0.0
p_t_test: 0.0000


For CO: Exp > Covid
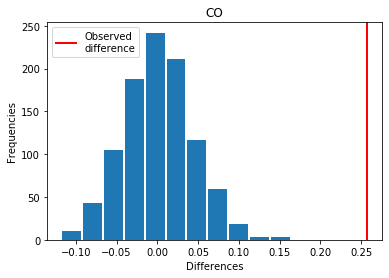
p_perm: 0.0
p_t_test: 0.0000


For GC: Exp > Covid
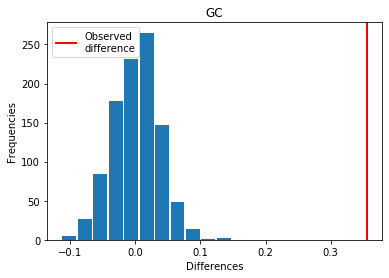
p_perm: 0.0
p_t_test: 0.0000


For IPC: Exp > Covid
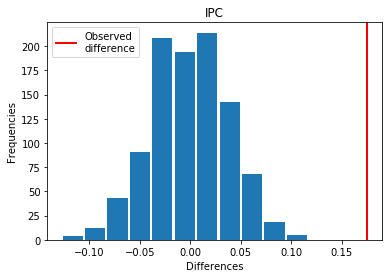
p_perm: 0.0
p_t_test: 0.0000


For LMX: Exp > Covid
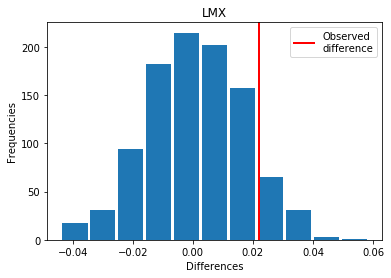
p_perm: 0.096
p_t_test: 0.0846


For LS: Exp > Covid
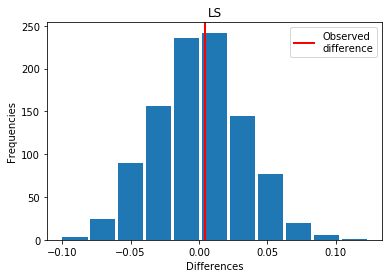
p_perm: 0.447
p_t_test: 0.4497


For MF: Exp > Covid
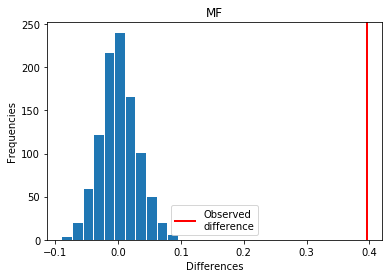
p_perm: 0.0
p_t_test: 0.0000


For PS: Covid > Exp
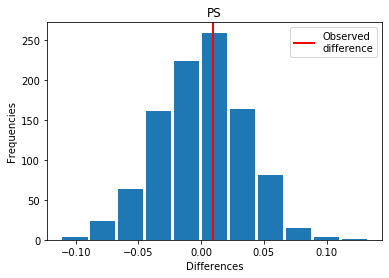
p_perm: 0.383
p_t_test: 0.3950


For RE: Exp > Covid
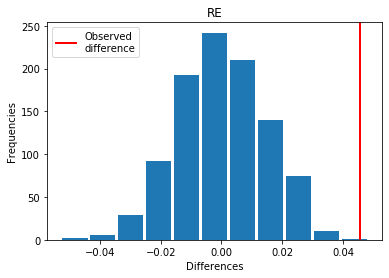
p_perm: 0.002
p_t_test: 0.0016


For WES: Exp > Covid
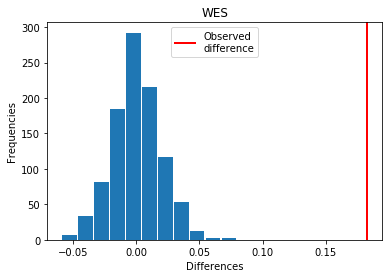
p_perm: 0.0
p_t_test: 0.0000


For WLC: Covid > Exp
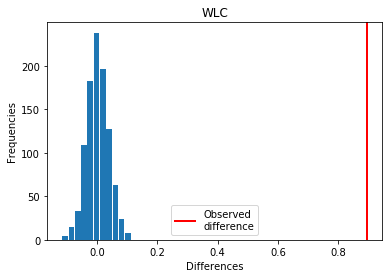
p_perm: 0.0
p_t_test: 0.0000


For WLSP: Exp > Covid
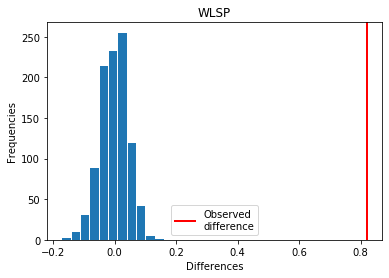
p_perm: 0.0
p_t_test: 0.0000
changes = {}

for i in label:
    read_data(i)
    array_A, array_B = read_data(i)
    combine(array_A, array_B)
    diff = np.mean(array_A) - np.mean(array_B)
    changes[i] = diff
changes = pd.DataFrame.from_dict(data=changes, orient='index', columns=['changes = exp - covid'])
changes['p_values_permutation'] = p_perm_list
changes['p_values_t_test'] = p_t_test
changes['p_values_t_test'] = round(changes['p_values_t_test'], 4)
changes['significant'] = changes['p_values_permutation'] <= 0.05
changes['significant'] = changes['significant'].astype(int)
changes
| changes = exp - covid | p_values_permutation | p_values_t_test | significant | |
|---|---|---|---|---|
| AHC | 0.345929 | 0.000 | 0.0000 | 1 |
| Bout | -0.182161 | 0.000 | 0.0000 | 1 |
| CO | 0.256943 | 0.000 | 0.0000 | 1 |
| GC | 0.355430 | 0.000 | 0.0000 | 1 |
| IPC | 0.174999 | 0.000 | 0.0000 | 1 |
| LMX | 0.021892 | 0.096 | 0.0846 | 0 |
| LS | 0.004266 | 0.447 | 0.4497 | 0 |
| MF | 0.395901 | 0.000 | 0.0000 | 1 |
| PS | -0.009199 | 0.383 | 0.3950 | 0 |
| RE | 0.045658 | 0.002 | 0.0016 | 1 |
| WES | 0.182599 | 0.000 | 0.0000 | 1 |
| WLC | -0.894634 | 0.000 | 0.0000 | 1 |
| WLSP | 0.819718 | 0.000 | 0.0000 | 1 |