My Bui (Mimi)
Data Engineer & DataOps
My LinkedIn
My GitHub
The NYC Department of Finance collects data on every parking ticket issued in NYC (~10M per year). This data is made publicly available to aid in ticket resolution and to guide policymakers.
The data set we’ll explore is in 2017. Since its size is quite large - 2.09 GB, we’ll apply the concept of ‘laziness’ from Dask. We’ll also visualize our analysis with interactive Plotly (not displayed here).
import dask
import dask.dataframe as dd
import pandas as pd
from dask.distributed import Client
client = Client(n_workers=4)
df = dd.read_csv('Parking_Violations_Issued_-_Fiscal_Year_2017.csv', parse_dates=['Issue Date'])
df
Dask DataFrame Structure:
| Summons Number | Plate ID | Registration State | Plate Type | Issue Date | Violation Code | Vehicle Body Type | Vehicle Make | Issuing Agency | Street Code1 | Street Code2 | Street Code3 | Vehicle Expiration Date | Violation Location | Violation Precinct | Issuer Precinct | Issuer Code | Issuer Command | Issuer Squad | Violation Time | Time First Observed | Violation County | Violation In Front Of Or Opposite | House Number | Street Name | Intersecting Street | Date First Observed | Law Section | Sub Division | Violation Legal Code | Days Parking In Effect | From Hours In Effect | To Hours In Effect | Vehicle Color | Unregistered Vehicle? | Vehicle Year | Meter Number | Feet From Curb | Violation Post Code | Violation Description | No Standing or Stopping Violation | Hydrant Violation | Double Parking Violation | |
|---|---|---|---|---|---|---|---|---|---|---|---|---|---|---|---|---|---|---|---|---|---|---|---|---|---|---|---|---|---|---|---|---|---|---|---|---|---|---|---|---|---|---|---|
| npartitions=33 | |||||||||||||||||||||||||||||||||||||||||||
| int64 | object | object | object | datetime64[ns] | int64 | object | object | object | int64 | int64 | int64 | int64 | float64 | int64 | int64 | int64 | object | object | object | object | object | object | object | object | object | int64 | int64 | object | object | object | object | object | object | float64 | int64 | object | int64 | object | object | float64 | float64 | float64 | |
| ... | ... | ... | ... | ... | ... | ... | ... | ... | ... | ... | ... | ... | ... | ... | ... | ... | ... | ... | ... | ... | ... | ... | ... | ... | ... | ... | ... | ... | ... | ... | ... | ... | ... | ... | ... | ... | ... | ... | ... | ... | ... | ... | |
| ... | ... | ... | ... | ... | ... | ... | ... | ... | ... | ... | ... | ... | ... | ... | ... | ... | ... | ... | ... | ... | ... | ... | ... | ... | ... | ... | ... | ... | ... | ... | ... | ... | ... | ... | ... | ... | ... | ... | ... | ... | ... | ... | ... |
| ... | ... | ... | ... | ... | ... | ... | ... | ... | ... | ... | ... | ... | ... | ... | ... | ... | ... | ... | ... | ... | ... | ... | ... | ... | ... | ... | ... | ... | ... | ... | ... | ... | ... | ... | ... | ... | ... | ... | ... | ... | ... | ... | |
| ... | ... | ... | ... | ... | ... | ... | ... | ... | ... | ... | ... | ... | ... | ... | ... | ... | ... | ... | ... | ... | ... | ... | ... | ... | ... | ... | ... | ... | ... | ... | ... | ... | ... | ... | ... | ... | ... | ... | ... | ... | ... | ... |
Dask Name: from-delayed, 99 tasks
df.head()
| Summons Number | Plate ID | Registration State | Plate Type | Issue Date | Violation Code | Vehicle Body Type | Vehicle Make | Issuing Agency | Street Code1 | ... | Vehicle Color | Unregistered Vehicle? | Vehicle Year | Meter Number | Feet From Curb | Violation Post Code | Violation Description | No Standing or Stopping Violation | Hydrant Violation | Double Parking Violation | |
|---|---|---|---|---|---|---|---|---|---|---|---|---|---|---|---|---|---|---|---|---|---|
| 0 | 5092469481 | GZH7067 | NY | PAS | 2016-07-10 | 7 | SUBN | TOYOT | V | 0 | ... | GY | NaN | 2001 | NaN | 0 | NaN | FAILURE TO STOP AT RED LIGHT | NaN | NaN | NaN |
| 1 | 5092451658 | GZH7067 | NY | PAS | 2016-07-08 | 7 | SUBN | TOYOT | V | 0 | ... | GY | NaN | 2001 | NaN | 0 | NaN | FAILURE TO STOP AT RED LIGHT | NaN | NaN | NaN |
| 2 | 4006265037 | FZX9232 | NY | PAS | 2016-08-23 | 5 | SUBN | FORD | V | 0 | ... | BK | NaN | 2004 | NaN | 0 | NaN | BUS LANE VIOLATION | NaN | NaN | NaN |
| 3 | 8478629828 | 66623ME | NY | COM | 2017-06-14 | 47 | REFG | MITSU | T | 10610 | ... | WH | NaN | 2007 | NaN | 0 | 04 | 47-Double PKG-Midtown | NaN | NaN | NaN |
| 4 | 7868300310 | 37033JV | NY | COM | 2016-11-21 | 69 | DELV | INTER | T | 10510 | ... | WHITE | NaN | 2007 | NaN | 0 | 31 6 | 69-Failure to Disp Muni Recpt | NaN | NaN | NaN |
5 rows × 43 columns
We check some basic info of the data set, e.g. number of partitions dask created.
df.npartitions
33
df.columns
Index(['Summons Number', 'Plate ID', 'Registration State', 'Plate Type',
       'Issue Date', 'Violation Code', 'Vehicle Body Type', 'Vehicle Make',
       'Issuing Agency', 'Street Code1', 'Street Code2', 'Street Code3',
       'Vehicle Expiration Date', 'Violation Location', 'Violation Precinct',
       'Issuer Precinct', 'Issuer Code', 'Issuer Command', 'Issuer Squad',
       'Violation Time', 'Time First Observed', 'Violation County',
       'Violation In Front Of Or Opposite', 'House Number', 'Street Name',
       'Intersecting Street', 'Date First Observed', 'Law Section',
       'Sub Division', 'Violation Legal Code', 'Days Parking In Effect    ',
       'From Hours In Effect', 'To Hours In Effect', 'Vehicle Color',
       'Unregistered Vehicle?', 'Vehicle Year', 'Meter Number',
       'Feet From Curb', 'Violation Post Code', 'Violation Description',
       'No Standing or Stopping Violation', 'Hydrant Violation',
       'Double Parking Violation'],
      dtype='object')
1. When are tickets most likely to be issued? Answer in different time periods
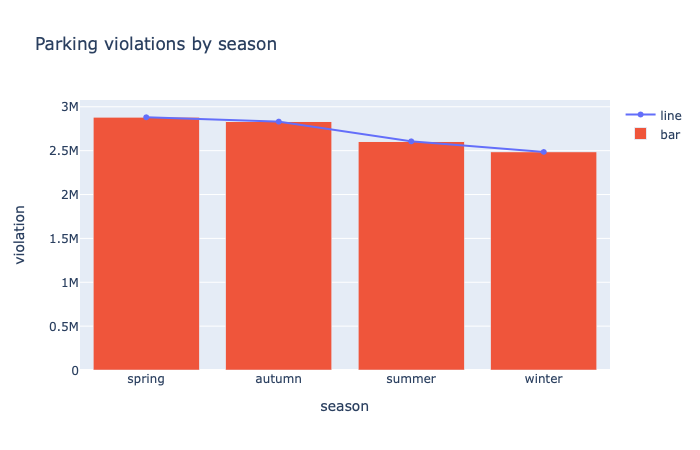
By season
New York Has A Continental Climate. New York’s climate is classed as being continental, which means that it receives four distinct seasons spring (March-May), summer (June-August), autumn (September-November) and winter (December-February.
# a helper function to get seasons from months
def get_season(df):
    seasons = df['Issue Date'].dt.month

    seasons.replace([3, 4, 5], 'spring', inplace=True)
    seasons.replace([6, 7, 8], 'summer', inplace=True)
    seasons.replace([9, 10, 11], 'autumn', inplace=True)
    seasons.replace([12, 1, 2], 'winter', inplace=True)

    return seasons
# map over df a function to return a Series season
result = df.map_partitions(get_season)
/Users/MimiHMB/anaconda3/lib/python3.7/site-packages/pandas/core/generic.py:6746: SettingWithCopyWarning: modifications to a property of a datetimelike object are not supported and are discarded. Change values on the original.
  self._update_inplace(new_data)
issue_season = result.value_counts()
issue_season_computed = issue_season.compute()
# violations happened more frequently in spring and autumn
import plotly.graph_objects as go

fig = go.Figure()

fig.add_trace(
    go.Scatter(
        x=issue_season_computed.index,
        y=issue_season_computed.values,
        name='line'
    ))

fig.add_trace(
    go.Bar(
        x=issue_season_computed.index,
        y=issue_season_computed.values,
        name='bar'
    ))

fig.update_layout(
    title="Parking violations by season",
    xaxis_title="season",
    yaxis_title="violation")

fig.show()
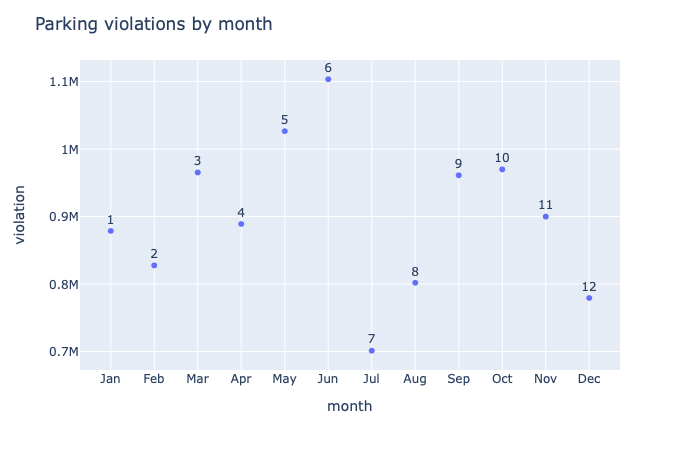
By month
issue_month = df['Issue Date'].dt.month
len(issue_month)
10803028
issue_month_computed = issue_month.value_counts().compute()
import plotly.express as px

months = issue_month_computed.sort_index().index
values = issue_month_computed.sort_index().values

fig = px.scatter(issue_month_computed, x=months, y=values, text=months)

fig.update_traces(textposition='top center')

fig.update_layout(xaxis = dict(tickmode = 'array',
                               tickvals = list(range(1, 13)),
                               ticktext = ['Jan', 'Feb', 'Mar', 'Apr', 'May', 'Jun', 'Jul', 'Aug', 'Sep', 'Oct', 'Nov', 'Dec']))

fig.update_layout(xaxis_title="month",
                  yaxis_title="violation",
                  title_text='Parking violations by month')

fig.show()
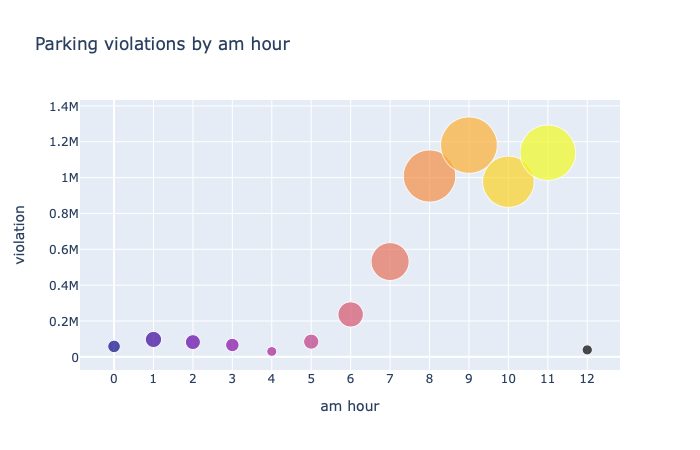
By am hour
am = [i[0:2] for i in df['Violation Time'] if ('A' in str(i))]
am_df = pd.DataFrame.from_dict(dict((i, am.count(i)) for i in set(am)), orient='index', columns=['count'])
am_df = am_df.sort_index()[4:]
am_df
| count | |
|---|---|
| 00 | 58313 |
| 01 | 97058 |
| 02 | 82352 |
| 03 | 66118 |
| 04 | 30163 |
| 05 | 84800 |
| 06 | 236777 |
| 07 | 531769 |
| 08 | 1008957 |
| 09 | 1181344 |
| 10 | 976913 |
| 11 | 1138919 |
| 12 | 38904 |
# violations happened mostly during 8-11 am
times = am_df.index
time_values = am_df['count'].values
size = time_values/10000

fig = go.Figure(data=[go.Scatter(
    x=times,
    y=time_values,
    mode='markers',
    marker=dict(
        size=size,
        sizemode='area',
        sizeref=1.*max(size)/(40.**2),
        sizemin=5,
        color=[220, 225, 230, 235, 240, 245, 250, 255, 260, 265, 270, 275]
    )
)])

fig.update_layout(xaxis = dict(tickmode = 'array',
                               tickvals = list(range(0, 13))))
fig.update_layout(xaxis_title="am hour",
                  yaxis_title="violation",
                  title_text='Parking violations by am hour')

fig.show()
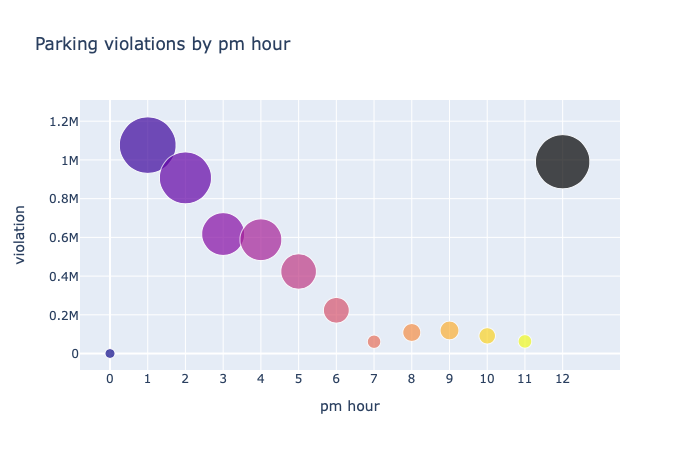
By pm hour
pm = [i[0:2] for i in df['Violation Time'] if ('P' in str(i))]
pm_df = pd.DataFrame.from_dict(dict((i, pm.count(i)) for i in set(pm)), orient='index', columns=['count'])
pm_df = pm_df.sort_values(by='count', ascending=False)[:13].sort_index()
pm_df
| count | |
|---|---|
| 00 | 261 |
| 01 | 1076390 |
| 02 | 907268 |
| 03 | 617187 |
| 04 | 587900 |
| 05 | 423884 |
| 06 | 223467 |
| 07 | 61111 |
| 08 | 108834 |
| 09 | 119346 |
| 10 | 91404 |
| 11 | 62722 |
| 12 | 990649 |
# violations happened mostly during 12-2 pm
pm_times = pm_df.index
pm_time_values = pm_df['count'].values
pm_size = pm_time_values/10000

fig = go.Figure(data=[go.Scatter(
    x=pm_times,
    y=pm_time_values,
    mode='markers',
    marker=dict(
        size=pm_size,
        sizemode='area',
        sizeref=1.*max(pm_size)/(40.**2),
        sizemin=5,
        color=[100, 105, 110, 115, 120, 125, 130, 135, 140, 145, 150, 155]
    )
)])

fig.update_layout(xaxis = dict(tickmode = 'array',
                               tickvals = list(range(0, 13))))
fig.update_layout(xaxis_title="pm hour",
                  yaxis_title="violation",
                  title_text='Parking violations by pm hour')

fig.show()
2. Where are tickets most commonly issued?
At which street
where = df['Street Name'].value_counts().compute()
# most issued at Broadway
where[:5]
Broadway         206157
3rd Ave          160282
Madison Ave       98853
5th Ave           90707
Lexington Ave     81199
Name: Street Name, dtype: int64
At which intersections
bw_int= df[df['Street Name'] == 'Broadway']['Intersecting Street'].value_counts().compute()
# top 20 intersections with Broadway street that parking violations occurred
bw_int[:20]
30ft S/of W 118th St    82
30ft N/of E 8th St      62
20ft S/of W 118th St    61
20ft N/of E 8th St      49
10ft N/of W 110th St    45
10ft S/of W 118th St    42
20ft S/of W 76th St     41
10ft S/of W 90th St     41
40ft N/of E 8th St      41
15ft S/of W 118th St    41
20ft S/of W 77th St     37
20ft N/of W 102nd St    37
30ft N/of W 102nd St    37
20ft N/of W 67th St     36
40ft S/of W 118th St    35
10ft N/of W 77th St     33
5ft N/of W 102nd St     31
30ft S/of W 76th St     31
10ft N/of W 102nd St    30
20ft N/of W 77th St     30
Name: Intersecting Street, dtype: int64
# a helper function to filter only street names
def get_int(df):
    filter = df[df['Street Name'] == 'Broadway']['Intersecting Street'].dropna().str.split().str.get(-2)
    return filter
broadway_int = df.map_partitions(get_int)
broadway_int_count = broadway_int.value_counts().compute()
# most commonly issued at the intersection of Broadway and 118th streets
broadway_int_count.sort_values(ascending=False)[:10]
118th      516
77th       478
8th        448
78th       435
76th       404
102nd      373
Britton    290
74th       284
82nd       258
107th      252
Name: Intersecting Street, dtype: int64
For which violation reasons
bw_desc = df[df['Street Name'] == 'Broadway']['Violation Description'].value_counts().compute()
# top 10 violation reasons at Broadway Street
bw_desc[:10]
38-Failure to Display Muni Rec    47029
37-Expired Muni Meter             29334
46B-Double Parking (Com-100Ft)    16541
14-No Standing                    15002
19-No Stand (bus stop)            12799
21-No Parking (street clean)      11571
69-Failure to Disp Muni Recpt      9755
31-No Stand (Com. Mtr. Zone)       8380
71A-Insp Sticker Expired (NYS)     6288
40-Fire Hydrant                    5490
Name: Violation Description, dtype: int64